In this article we will continue our discussion of the inconsistencies of the Big Bang theory, focusing now on redshift and the fallacious idea of the expanding universe myth. We will also take a look at the work of Dr. Halton Arp and his extremely important data that effectively proves the Big Bang theory incorrect.
“It would seem that the modern physicist is so specialized in the physics of today that he has lost the aptitude to adapt to new ideas.”1 Harold Aspden

The Expansion of the Universe & Redshift
The phenomenon of redshift is the single most important piece of evidence used to ‘prove’ the universe is expanding. In the conventional view, “the light traveling from the supernova towards Earth is stretched because the universe is expanding and so space also expands. The stretched light’s wavelength is shifted towards the red part of the spectrum.”2 This is called cosmological redshift and it is based on fallacious data.

What is Redshift?
Redshift is a microwave frequency measured as a cosmic distance.

Longer red wavelengths supposedly signify a moving away from the observer. Shorter blue wavelengths supposedly signify a moving towards the observer.
Positive redshift occurs when the lines in the spectrum of light from a star or galaxy appear at a lower frequency (shifted towards the red spectrum of wavelengths of the electromagnetic spectrum) than where they are observed in the spectrum of the Sun.
The mainstream explanation is that the object must be moving away from us.
This idea is related to the Doppler shift. There is a downward shift in the pitch of a train whistle as it passes through a railroad crossing and then speeds away from us.
The train’s whistle has a higher pitch when approaching you. The whistle has a lower pitch when moving away from you.
This Doppler effect is caused by compression or stretching of sound waves.

Credit: Zappy’s Technology Solutions
In this image the sound of the car coming towards person A creates a shortening of wavelength (and higher pitch). This is blueshifting. The sound of the car moving away from person B creates a lengthening of wavelength (and a lower pitch). This is redshifting.
Mainstream science assumes that light waves do the same thing as sound waves, though the object must be moving at very, very high speeds to detect it.
Therefore, a star approaching the observer would emit light waves compressed or shifted towards the blue spectrum.
If a star is zooming away from the observer, the light waves would stretch, shifting towards the red.

The set of black lines are shifted to the red here for very distant galaxies and shifting towards the blue-violet for nearby stars.
For this assumption to be correct, galaxies must be moving at speeds so fast they are approaching the speed of light! This flies in the face of all common sense, and it has been extensively proven wrong. Yet, for some ridiculous reason, mainstream science still clings desperately to this idea as if it is a sacred religious belief they cannot deny.
Before the use of redshift, astronomers used stellar parallax to determine distances of galaxies or stars from Earth.
To use parallax to determine distances, astronomers must observe the position of a star relative to Earth in January and in July to measure the shift throughout the year. A nearby star will look differently in the night sky as you move from one position to the other. This difference will give the parallax angle. Knowing this, you can calculate the distance from the star to the Earth using the Pythagorean Theorem.

In this diagram we can only know for sure the distance of the Earth from the Sun. We can also only know the distance from the Earth to a near star approximately. This is shown in the lower triangle. In the upper triangle only the short end of the triangle is known. This is found by calculating the parallax angle. You cannot use the Pythagorean theorem knowing only one variable. It is a very crude approximation, at best.
It is all based on assumptions. The only absolute known is the distance from the earth to the sun. In order to use the Pythagorean Theorem you also need an absolute measurement of the sun to the star. This is unknown. We have only one leg of the triangle. These are abstract calculations. They are not necessarily accurate.
“Once a star’s parallax is known, its distance from Earth can be computed trigonometrically. But the more distant an object is, the smaller its parallax. Even with 21st-century techniques in astronomy, the limits of accurate measurement make distances farther away than about 100 parsecs (roughly 326 light years) too approximate to be useful when obtained by this technique.”3
To repeat: Anything past 326 light years will not be accurate. It is only good for close distances. Astronomers needed another way.
The idea of redshift as a factor to determine the distance of a celestial body from Earth began with Henrietta Leavitt’s discovery of the period-luminosity relation for Cepheid variable stars.

Henrietta Leavitt
Cepheid variables are pulsating stars that vary in brightness, temperature, radio emission and width. There is a smooth relationship between how much they pulsate, the duration of pulsation, temperature changes and brightness changes.
Henrietta Leavitt (1868-1921) studied 1777 variable stars in the Magellanic Clouds in 1908. In 1912 she confirmed that stars with greater luminosity had longer periods of pulsation. She then assumed that all Cepheids within each Magellanic Cloud were approximately the same distance from Earth.
This assumption was ultimately used to calculate apparent distances all throughout the cosmos.
From there she determined that the true luminosity of a Cepheid can be determined by observing its pulsation period. “This in turn allows one to determine the distance to the star, by comparing its known luminosity to its observed brightness.”4

Leavitt, despite her groundbreaking work in astronomy, was virtually unknown. She was paid 30 cents an hour for her work and died of cancer at 53 years.
“Though she received little recognition in her lifetime, it was her discovery that first allowed astronomers to measure the distance between the Earth and faraway galaxies. She explained her discovery: ‘A straight line can readily be drawn among each of the two series of points corresponding to maxima and minima, thus showing that there is a simple relation between the brightness of the variables and their periods.’”5
After Leavitt’s discovery, Danish chemist and astronomer Ejnar Hertzsprung (1873-1967) used the system of annual parallax to measure the distances to Cepheid stars in 1913. He correlated Leavitt’s data with distances and believed this could be used to determine any distance of any object throughout the cosmos.

Ejnar Hertzsprung
Later, Edwin Hubble (1889–1953) used her work to demonstrate the relation between redshifts of galaxies and their distances.

Edwin Hubble
He used the assumption of the direct relationship between brightness and pulsation period as a benchmark for scaling distances.
He found Cepheid variables in several spiral nebulae including the Triangulum and Andromeda nebulae. In 1922-23 he proved they were far too distant to be a part of the Milky Way. This proved Emmanuel Kant’s 1755 theory of other galaxies. This allowed Hubble and astronomer Harlow Shapley (1885-1972), to move our galaxy from the center of the Universe, where it was previously thought to reside. This settled the “Great Debate” that there was more than one galaxy in the universe.
After the debate was settled Hubble identified many galaxies outside our own. He created a ‘tuning fork diagram’ classification system of galaxies in 1927 based on their appearances. This became known as the Hubble sequence and is still used today.

Hubble Tuning Fork Diagram

This classification can be seen in the Shapley-Ames Catalog. Galaxies are given various code names depending on their shape.
Hubble believed galaxies began as an elliptical galaxy then grew into either a regular spiral galaxy or a barred spiral galaxy.
Hubble is credited with the ‘discovery’ of the expanding universe. At first he believed the universe was in a constant state of expansion. As time went on, however, he grew to doubt the idea.
Hubble Doubted the Expanding Universe Theory
Hubble assumed all galaxies should be moving away from each other at a steady rate of speed. His measurements of 46 galaxies would lead to an average speed of 500 km/s/Mpc. This is now considered much too high due to errors in their distance calibration.
Hubble, doubting the interpretation, wrote a letter in 1931 to Dutch cosmologist Willem de Sitter:
“Mr. Humason and I are both deeply sensible of your gracious appreciation of the papers on velocities and distances of nebulae. We use the term ‘apparent’ velocities to emphasize the empirical features of the correlation. The interpretation, we feel, should be left to you and the very few others who are competent to discuss the matter with authority.”6
“’The expanding universe,’ Hubble wrote, ‘is the latest widely accepted development in cosmology,’ but it depends on assuming red shifts are velocity shifts.
Hubble’s work with cosmologist Richard C. Tolman led to another way to answer the question. They looked at two simple models based on the assumption that the redshifts (a) are, or (b) are not, velocity shifts, and applied them to the observational data.
The conclusion of the Hubble-Tolman collaboration was that the model (a) could be made to fit the data only with unrealistic assumptions about the density and size of the universe.
They seemed to favor model (b), with the assumption that the universe is static and ‘photons emitted by a nebula lose energy on their journey to the observer by some unknown effect.
Hubble said, ‘the expanding models are definitely inconsistent with the observations unless a large positive curvature (small, closed universe) is postulated,’ which gives an unreasonable high density as well as a ‘small scale…both in space and time.’ On the other hand, the non-expanding model (b) gives a ‘rather simple and thoroughly consistent picture’. It is ‘more economical and less vulnerable, except for the fact that, at the moment, no other satisfactory explanation [of red shift] is known.’”7
Dr. Halton Arp (1927-2011) – Hubble’s Protégé
Dr. Halton Arp was Edwin Hubble’s assistant in his early years. He received his bachelor’s degree from Harvard and his PhD from CalTech. He trained under Hubble, at first believing in the redshift dogma. He became a fellow of the Carnegie Institution of Washington in 1953. In 1957 he became a staff member at Palomar Observatory in California. He worked there for 29 years before he was shunned for his discoveries that proved the idea that redshift equaled universe expansion was false.

Dr. Halton Arp
He developed the well-known “Atlas of Peculiar Galaxies” in 1966.8 These showed galaxies that were misshapen or irregular.
He later wrote two books: Quasars, Redshifts and Controversies and Seeing Red: Redshifts, Cosmology and Academic Science. Both of these denied the ‘redshift equals velocity’ dogma and tore the expanding universe myth to shreds.
He was eventually black-listed for his controversial findings, refused publication, denied telescope time, and was forced to leave the US to pursue his work. Since then, there has been a 50 year suppression of Arp’s work.
This was all too similar of the priests of Galileo’s time refusing to look in his telescopes for fear of being proven wrong.

Galileo Galilei by Peter Paul Rubens, 1630
Both Arp and Galileo were respected scientists and popular leaders in their field. Both made observations which contradicted the accepted theories.
In 1615, the ecclesiastical authorities forced Galileo to stop looking through his telescopes. He was tried by the Inquisition, found “vehemently suspect of heresy”, “foolish and absurd in philosophy…since it explicitly contradicts in many places the sense of Holy Scripture”, was forced to recant and put on house arrest for the remainder of his life.9
Not until 1992 did the Catholic Church admit errors in handling his case. That was 337 years after his ridiculous trial!
Will we have to wait 337 more years before Arp’s scientific proof is accepted? I hope not, yet that seems to be the way of this strange, strange world we’re living in.
Incidentally, Galileo’s right middle finger is on display in Florence, Italy at the Museo Galileo. He gets to give the middle finger to the world that shunned and punished him for uncovering the truth. Sadly, this does not help Arp and it does not get us closer to ushering in a new scientific revolution for the greatest good of all.
“[Arp’s] discovery sounded the alarm in some halls of Academe and since nobody likes a loud noise – particularly if they are asleep – the knee-jerk response was to attack the guy with his finger on the alarm button.”10
Arp’s Unusual Galaxies
Arp found a total of 338 nearby galaxies that did not fit into Hubble’s classic categories of shapes. They are still generally known as their name Arp, followed by a number. The numbers 1 through 101 were otherwise conventional galaxies that appeared to have small companion objects that were very energetic. Many of these objects were found to be quasars!
He saw a galaxy connected to a quasar by a filament. At the time, no one knew what a quasar was. Arp thought they were seeds or babies of a galaxy. He believed that the quasar was being spit out from a galaxy, which he called an active galactic nucleus. It left a trail of gas and dust as it was spit out.

Hundreds of quasars (baby galaxies) were recorded by 1960.
“It is never good science to ignore anomalous data or to eliminate a conclusion because of some presupposition…To do so may not place one in the mainstream of modern science, but at least we will be searching for truth and moving ahead rather than maintaining the scientific status quo.” Barry Setterfield
Redshift and Z-Values
A z-value is the observed fractional increase in the wavelength of the spectral lines.
The normal wavelength of the sun gives a standard benchmark of z value = 1. If a star measures at 1.56 the ‘normal wavelength’ it has a z of 0.56. The theory believes the object must be receding from us at 56% light speed.
This would add up to 0.56 x 300,000 km/sec.11
This led to the simple equation v=cz.
v = star’s velocity; c = speed of light; z = redshift
Supposedly the higher the z number, the farther away the object.
This equation is a total assumption. Arp thoroughly debunked this theory!
“Arp began looking at quasars and noticed that many appeared to be lying quite close in the sky to galaxies, sometimes in alignment with them. In 1971 he claimed to have found a “bridge” of gas joining a galaxy named NGC 4319 and a quasar that sits next to it in the sky.”12
He discovered many pairs of quasars (quasi-stellar objects) with extremely high redshift values yet were physically associated with galaxies that have low redshift values and are known to be relatively close by.
As Sir Henry Dale said, “Science should not tolerate any lapse of precision, or neglect any anomaly, but give Nature’s answers to the world humbly and with courage.”
Prime Example – NGC 4319 and Markarian 205
There is a physical connection between these two entities. NGC 4319 (z=0.006) is a barred spiral galaxy. Markarian 205 (z=0.70) is a quasar like object.

NGC is seen as the bright galaxy in the center. Markarian 205 is the bright spot the upper right.
They have dramatically different z-values, yet they are physically linked. Their z-values would lead one to believe they are on opposite ends of the universe! NGC 4319 (z-value 0.004526) would be approximately 80 million light-years from Earth while Markarian 205 (z-value 0.070846) would be almost 1.2 billion light-years from Earth. This is ridiculous.
The physical link was obtained by amateur astronomer John Smith of Oro Valley, Arizona in April 2002.
NASA also captured an image of these objects in October 2002 – the link can be seen. However, NASA scientists “cannot see any connection between these two objects”.
Here is an up-close shot taken directly from the Hubble Site. The light grey matter bridge is very, very faint:

Below is the same image. It was opened in Photoshop. Adjustments – Color Gradient, then Adjustments – Posterize. This reduces the range of colors to bring out the contrast. Notice the faint purple bridge of matter that connects the two.

There is no way these two celestial bodies are separated by 1 billion 120 million light-years.
This cannot happen in the conventional astrophysical model, yet Arp found evidence of it over and over again!
Example #2 – Stephan’s Quintet
Stephan’s Quintet is composed of five interacting galaxies: NGC 7317, 7318A, 7318B, 7319 and 7320.

Ground-based overview of Stephan’s Quintet taken at the Kitt Peak National Observatory’s 0.9-meter telescope in October of 1998 by Nigel Sharp. North is up, east is to the left.
7320 (the upper one of the main central 3 galaxies) has a redshift of 800 km/s. The others range between 5700 or 6700 km/s. This means that the upper galaxy (7320) is supposedly 7 times closer to Earth than the other galaxies.
There is not supposed to be an interaction between them. Yet an interaction tail can be seen coming off 7320, curving around to connect to the small galaxy NGC 7320C (z = 0.02) with a z-value ten times that of 7320.

Example #3 – NGC 7319
This example shows a quasar in front of a nearby galaxy.
NGC 7319 has z = 0.0225. The quasar in front has z = 2.11.

The arrow is pointing to the quasar between the Earth and the galaxy.
It shows a jet of matter extending out from the center of 7319 toward the quasar.
“This observation of a quasar between the galaxy and Earth is impossible if the quasar is over ninety times farther away than the galaxy.”13
Example #4 – Virgo Cluster
In this example the brightest galaxies, brightest quasars and brightest galactic clusters in the middle of the constellation are connected by the strongest radio and x-ray fields in the sky.

The expanding universe theory separates these objects by billions of light-years and assumes their side-by-side position is coincidental!
Example #5 – NGC 7603
In this example we see a galaxy connected to three objects: Object 1 (z = 0.057); object 2 (z = 0.243); object 3 (z = 0.391).
This means Object 2 would be over 3.6 billion light-years from Earth and Object 3 over 5.4 billion light-years from Earth.

Object 1 is the brightest small object at the bottom left. Objects 2 and 3 are the tiny specks of light inside the gaseous filament! These cannot all be tricks of the eye as NASA claims.

The matter bridge can very clearly be seen between NGC 7603 and Object 1, with Object 2 & 3 inside the jet.
Remember, Arp discovered hundreds of them!
Quasar Birth from Active Galaxies
Quasars are typically emitted from their parent galaxies with inherent redshift values of up to z = 2.
They continue to move away, with stepwise decreasing inherent redshift. Often, when inherent redshift gets around z = 0.3, the quasar starts to look like a small galaxy or BL Lac object.
It then begins to fall back, with still decreasing redshift values, toward its parent.
There are photos taken of many such family groups.
Quasars then, are NOT the brightest, most distant and rapidly moving things in the universe. They ARE among the youngest!
Interacting Galaxies
These galaxies are traditionally thought to be colliding.
First off, the high precision that would be needed for these ‘almost fast as light’ galaxies to collide with each other would be akin to two people shooting high-speed sniper rifles at one another and having the two bullets collide with one another…and then have this happening over and over again in the galaxy. It’s absurd.
This mainstream concept of ‘colliding galaxies’ (or merging galaxies) is false. It is especially misleading when called upon to explain a priori assumptions, for example, “quasar activity is induced in host galaxies by galactic collisions.” This means, mainstream scientists often say high-energy quasars are the result of the explosion that happens from the force of two galaxies colliding.14

Credit: NASA/Hubble
As proven by Arp, in most cases it is accurate to replace the randomly occurring ‘colliding galaxy’ with the evolutionary process ‘ejecting galaxy’.
Black Holes – Active Galactic Nuclei
Returning to our subject from the previous articles, we have even more evidence that black holes are not the cannibalistic destroyers of mass and energy that were previously thought. When we see galaxies tangled together in a high-energy mass we’re witnessing the birth of a new generation of quasars, galactic groups and companion galaxies.

Remember, every black hole has a white hole as its galactic halo. These white holes are stars. Every star is a white hole with a black hole in the center.
Galactic Clusters
A galactic cluster is a family of galaxies, quasars and gaseous clouds of varying redshifts. At the center lies a dominant galaxy – usually the largest with the lowest redshift.
The dominant galaxy is surrounded by low-to-medium redshift galaxies. Toward the edges we find highest redshift galaxies, HII regions, BL Lac objects and quasars.15
Yet these are all in the same galaxy, in the same area of the universe, even though they have varying redshifts. The redshifts show age, not distance!
“If we try to force this configuration into a redshift-equals-velocity-equals-distance relationship, as Big Bang cosmologists do, the cluster will be distorted. What was once a sphere becomes an elongated bubble. The central dominant galaxy drops to the front of the bubble, followed by a spike of low-to-medium redshift galaxies stretching away from the earth (see illustrations: “Seeing Red…” pp. 69 and 71). Every cluster in the sky does this, like starfish arms pointed away from the earth in every direction.”16
Forcing the data into this configuration flies in the face of common sense and scientific scrutiny. Ask yourself, why do astronomer’s keep pushing this dogma?

Compare this to an actual plot of the Virgo cluster. Using the traditional model it creates a long narrow finger pointing directly at Earth (at the bottom apex of the V). This is called the “Finger of God”. If it were accurate, it would mean the Earth was the center of the universe. It isn’t! The redshift model is incorrect. A galactic cluster is not spread out over a vast portion of the universe. A cluster is ‘clustered’ in the same region of space.

Arp’s data proves what should be common sense.
Arp’s New View of the Universe
Dr. Arp’s evidence favors a steady state cosmology and undermines the Big Bang myth. The universe did not explode out of ‘nothing’ and is still moving at an incredible speed that approaches light speed.
When speaking of extragalactic objects, the term “high redshift” means young. It does not imply ‘far away’, high velocity, or expanding universe. Those are simply assumptions.
Background objects are much closer than previously thought. Our local cluster has more members than presently believed.
Before Arp, only objects with redshifts below 300 km/sec were admitted to the local cluster. From Arp’s observations higher redshift dwarf galaxies and galaxies interacting with local-group nebulosity are also part of the local group.17
The age of the universe can no longer be counted by retro-calculating an expanding universe back to a singularity. Everything is not expanding at near light-speed.
Distances, masses and luminosities of high-redshift quasars, galaxies and clusters need to be recomputed as a function of something other than their redshift.
There is no other model known that can compute these long distances and that annoys and disturbs astronomers. Our methods are quite primitive and we aren’t as knowledgeable as we would like to believe. We are so far from being ‘masters of the universe’ it is laughable.
Example #6 – Einstein’s Cross
We first saw this example in Article 89. As we know it has to do with gravitational lensing.
We discovered, in Article 89, that light passing through various layers of density of a fluid-like medium would cause the same effects we see in gravitational lensing. We will discuss these various layers of density in the next article.
Arp backs up that finding by discovering that every galaxy has a high redshift in the center and a low redshift on the outside. The z-value increases in layers – that is, quantized layers, which means there is a sudden jump in values. This means there are concentric spheres expanding away from the center. These represent densities of Aether – that is, different planes of reality with different density levels.
Back to Einstein’s Cross, the mainstream view is that four images of the same star are wrapping around the nucleus of a quasar. However, there have been distinct changes in brightness in the cross between 1991 and 1994.18 If it is supposed to be the same star, then they should all change in the same way.
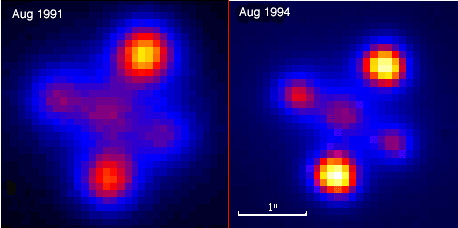
NASA explains it away by saying a star got in the way! However you should see the star if it got in the way! If it was too small to see, then it should not affect the gravitational lensing! Their excuse is ridiculous.
Notice that a bridge of high redshift hydrogen connects two of the quasar images and crosses in front of a lobe of the low-redshift galaxy. This proves conclusively that these images are not the same quasar, nor are they background objects.
In this case, these are bodies being ejected. It appears they are being ejected in a tetrahedral formation. This is not a case of gravitational lensing at all.
Two Components to Redshift
There are two components to redshift, the inherent component and the velocity component.
The Inherent Component shows the property of the matter in the object.
It changes over time in discrete steps. It is an indication of the objects youth and it usually makes up the larger fraction of a quasars total redshift.
The Velocity Component means that any additional redshift over its inherent value is indicative of its velocity.
Raw measured total redshift values are not quantized. Only the inherent redshift values are.
“The assumption that redshift can only be caused by recessional velocity predetermines a distorted understanding of the shape, age, size, and physical characteristics of most of the extragalactic universe. A different – intrinsic – interpretation of the redshift will imply a much different universe.”19
Conclusion
Over the course of this series of articles we have shown a large number of data that disproves the Big Bang theory, the Expanding Universe theory and the theory that redshift equals distance.
With the addition of Halton Arp’s work, there can be no doubt these theories are false.
The universe is badly in need of repair and re-evaluation. Observations do not support the theoretical constructs of the expanding universe and Big Bang cosmology. It is crucial that science is supported by observational evidence.
In the next article we will continue our discussion of redshift, focusing on the quantized aspect of redshift and how this indicates varying densities of Aether which relate to differing planes of existence.
Science always circles around back to spirituality and spirituality always circles back around to science.

- Aspden, Harold, Modern Aether Science, Sabberton Publications, 1972
- http://www.passmyexams.co.uk/GCSE/physics/the-expanding-universe-red-shift.html
- https://en.wikipedia.org/wiki/Stellar_parallax
- https://en.wikipedia.org/wiki/Cepheid_variable
- https://en.wikipedia.org/wiki/Henrietta_Swan_Leavitt
- Kirshner, Robert P, Hubble’s diagram and cosmic expansion, Harvard-Smithsonian Center for Astrophysics, October 21, 2003, http://www.pnas.org/content/101/1/8.full.wrong
- Brush, Stephen G & Ariel Segal, Making 20th Century Science: How Theories Became Knowledge, Oxford University Press, 2015
- http://ned.ipac.caltech.edu/level5/Arp/frames.html
- https://en.wikipedia.org/wiki/Galileo_Galilei
- http://www.holoscience.com/wp/synopsis/synopsis-4-what-big-bang/4/
- http://electric-cosmos.org/arp.htm
- UK Telegraph
- http://electric-cosmos.org/arp.htm
- https://www.bibliotecapleyades.net/ciencia/esp_ciencia_haltonarp.htm
- ibid.
- ibid.
- ibid.
- Http://hyperphysics.phy-astr.gsu.edu/hbase/Astro/eincros.html
- https://www.bibliotecapleyades.net/ciencia/esp_ciencia_haltonarp.htm
Recent Comments